Welcome to DesignBuilder’s July Newsletter! In this edition we bring you:
- Featured Case Study: Actual Year Weather Data for Calibrated Models
- DesignBuilder Award Honours UCL MSc Students
- IBPSA-England Webinar: Weather Files in BPS
- Top Tip: Using Custom “Pass/Fail” Daylight Distribution Maps
Building energy models are commonly developed during the design phase to check façade and system performance and ensure regulatory compliance. More recently, these models are also being calibrated and used as a valuable ongoing resource during the operational phase to confirm that buildings continue to meet their design intent.
Model calibration adjusts design-stage model inputs to reflect a building’s real-world operational performance. An essential step in developing a calibrated model is to access weather data corresponding to the exact site location and calibration period, instead of the typical year weather commonly used in design-stage simulations.
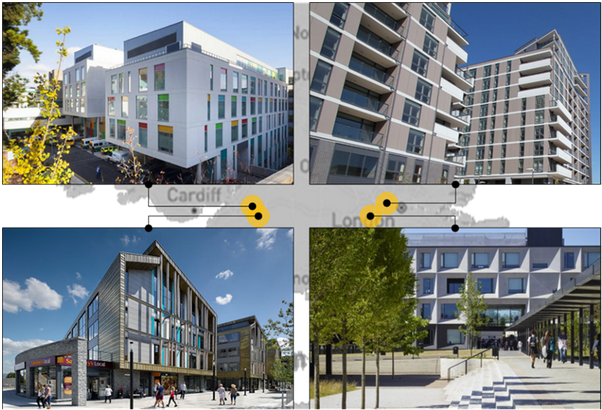
Our latest case study describes how DesignBuilder Climate Analytics Actual Year data was used to help calibrate the models of four buildings in the UK in accordance with the CIBSE TM63 and ASHRAE Guideline 14 standards.
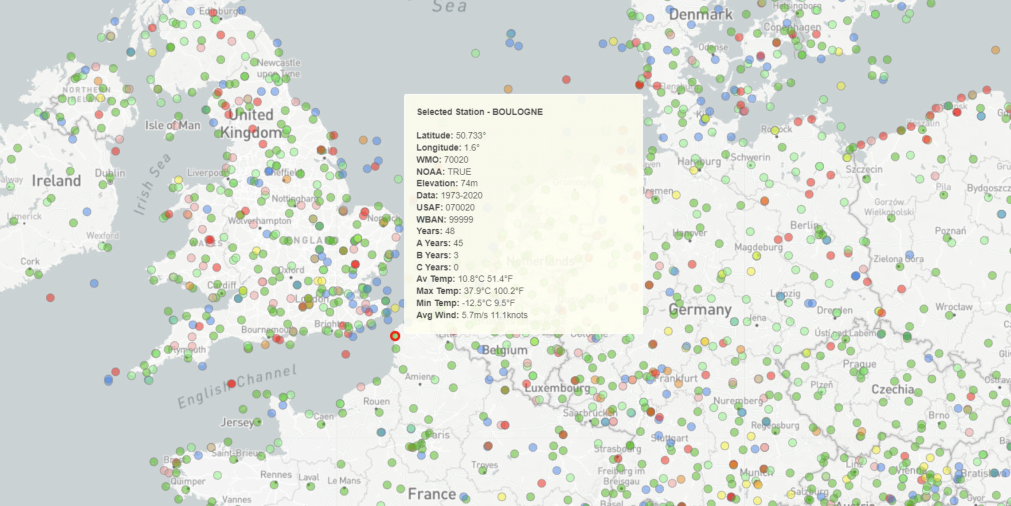
Climate Analytics is a new platform that provides access to a vast database of high-quality historical and future hourly weather data. It includes analysis tools to help you select the most appropriate data for your modelling projects and enables you to create your own weather files for any location and purpose. A recent webinar offers a deep dive into the details of this unique platform.
read the case studyDesignBuilder Award Honours UCL MSc Students

Two high-flying UCL Smart Buildings and Digital Engineering MSc students were recently presented with the prestigious DesignBuilder Award for their outstanding performance in modelling. This honour recognises their exceptional abilities and potential in the field. The award, presented by DesignBuilder in collaboration with UCL, includes a £250 prize and an internship opportunity. A joint academic and industrial panel assessed the candidates based on their past and current achievements, as well as their potential contributions to the industry.
Saumya Uttam was the recipient of the DesignBuilder – UCL award, having submitted the most impressive application. Her extensive background in architecture, accompanied by robust experience in building performance modelling and simulation set her apart.
Mariam Shehata received a high commendation for her excellent application and initiative-taking spirit demonstrated through regular participation in international design competitions, working in interdisciplinary teams, and testing herself against the best.
Congratulations to Saumya Uttam and Mariam Shehata on their well-deserved recognition!
IBPSA-England Webinar: Weather Files in BPS
With growing concerns over the impacts of climate change, access to appropriate, high-quality weather data is an increasingly important consideration for building performance modellers. In this IBPSA England webinar, Nishesh Jain will discuss weather files and preview DesignBuilder’s exciting new Climate Analytics tools.
Nishesh’s presentation – Right weather for the right modelling application: What, How and Where? will explore the nuances of different weather files, discuss their use in typical applications, and provide guidance on common weather-related mistakes. You can register to attend the live webinar or receive a recording here.
Register for the WebinarTop Tip: Using Custom “Pass/Fail” Daylight Distribution Maps
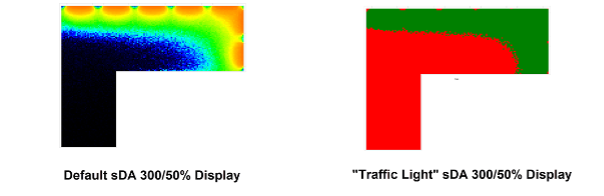
DesignBuilder’s false-colour daylight map outputs provide a comprehensive view of the daylight distribution across internal areas. Sometimes, however, a simplified view is all you need – showing areas within zones that meet and fail the daylight standard.
DesignBuilder allows you to refine your detailed daylight results to a pass-or-fail distribution map. To do this for sDA (300/50%), follow these steps after running an annual daylighting simulation.
- Navigate to the zone of interest.
- On the Display Options panel, under the Scale header, change the Source to ‘4-User-defined’. This lets you set thresholds and use colours to show areas that exceed them.
- Set the ‘Low value’ to 50% of the total occupied hours for the zone, 50, indicating that sDA outputs below 50% of occupied periods are not daylight autonomous. You can find the number of hours by temporarily setting the Source to 3-Zone and noting the highest value on the legend.
- Check the ‘Apply scale “too dark” colour’ checkbox and set the ‘Scale “too dark” colour’ to red to indicate fail.
- Set the ‘High value’ to be the same as the ‘Low value’.
- Check the ‘Apply scale “too bright” colour’ checkbox and set the ‘Scale “too bright” colour’ to green to indicate pass.
- Compliant areas of the working plane are now shown in green, and non-compliant areas in red.
You can find more information about Daylighting display options in the Program Help.